 Is this what's considered clean power? The power monitor I bought earlier this month can not only capture data, but show it in a spreadsheet, or graph it in a wide variety of ways.
One of the things it can do is visualize how clean my power is (TXU ultimately supplies it). I suppose I should be looking for a flat line at the 125 volt line, but it dipped to 122 on the low end and nearly 128 on the high end, over a two-day span.
This measurement is from a television set that's not connected to a UPS, which presumably would tidy things up a bit.
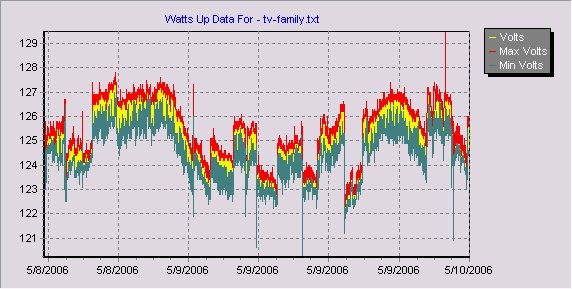 Here's another view of the data, adding the "Minimum Volts" and "Maximum Volts" measurements, showing even deeper troughs and higher peaks. Maybe I should return to school for one of them Double-E degrees, so I can understand what I'm a-lookin' at?

1 comment:
Maybe you could start with TFM to see what they claim to be reporting.
Then again, even if the power were perfect when it left the generator there are gazillions, if not gadzillions, of points between Three Mile Island (or wherever your power is born) and you where the voltage can be dragged down or boosted for fractions of a second (or longer).
The result is something that doesn't look like your typical high-school sine wave (or a flat line if you're looking at RMS voltage).
Post a Comment